

Post by solar2016 on Mar 9, 2017 19:07:36 GMT 5.5
The biggest lie against renewable energy : පුනර්ජනනීය ශක්තිය – ඇත්ත සහ බොරුව
www.green-frontiers.net, 18th October 2016, By Green Frontiers

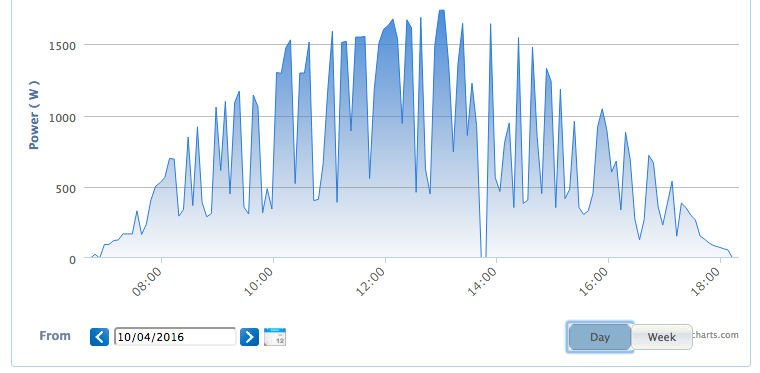
Above chart is from a typical home solar system which powers the home and charges an electric vehicle as well. System has just 6 panels (1.8KW, generating around 200 units monthly). Such a system should cost only around Rs 350 000/=.
Now, the point is the time frames. System start producing up to 30% of it’s full capacity by as early as 8AM in morning. It can keep producing 30% of the capacity even as late as 5PM in the evening. What this mean is that if we have enough solar panels (which are pretty cheap these days and getting cheaper every month) deployed around the country, we can power our energy needs from 8AM to 5PM a full 9 hours!
A shortage of sunlight in one area of the country will be offset by another area if solar systems are scattered around the country. Unlike traditional power plants they don’t have to scatter all in one place! Even if we have large scale solar farms, we could still distribute those farms across country.
There is a perception that the electricity is primarily needed in the night. It is understandable common citizen would believe as such because that’s the pattern of our home consumption. However, as a country, that’s not the situation. All those factories, industrial zones, work places, offices, businesses, shops they all consume more energy at day time than in night.
So, powering 8-9 hours of day time with solar seems to be a huge achievement if we can reach that! this brings up the question, exactly how much electricity (as a % from our total consumption) do we consume at day time ? and how much solar energy we produce currently to meet that consumption. Second part of the question is easy enough to answer. As per 2014 data, solar power is around 1% of our total electricity generation.
Exactly how much % of electricity do we consume at day time?
Lie (බොරුව) : Sri Lanka need electricity mainly at night, so producing solar at day time is of little use, we will anyway have to produce electricity at night in the current capacity using all our coal and diesel plants. We will have to build new ones too in order to meet the growing demand.
Truth (ඇත්ත) : Total night time electricity demand (in MWh) and total day time electricity demand (in MWh) are more or less same in Sri Lanka. (in work days at least). Therefore we have scope to increase solar electricity (currently at just around 1%) by several folds and actually solve a big part in our energy problem.
It was difficult to find direct stats on day time and night time use, so we used following analysis from available and verified data. If anyone one has access to any published and official figures they are most welcome to share those in here.
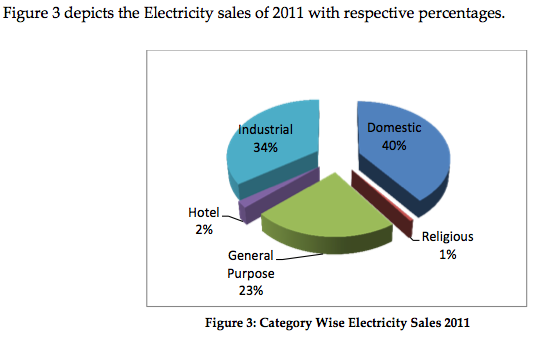
According to 2012 statistics, following is the distribution of electricity sales in Sri Lanka across different categories. Note that Domestic usage is only 40% and about 60% are either Industrial (factories, workshops etc), General purpose (offices, businesses, shops etc) or Hotels.
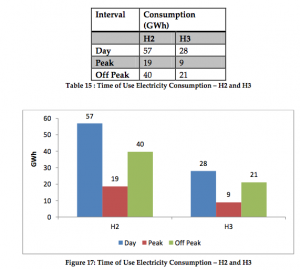
Following is the hotel sector power usage pattern. Day time usage is the highest component and is roughly 50%
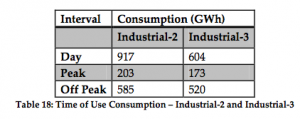
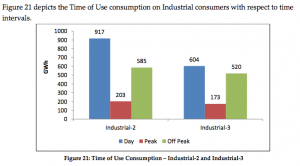
Below chart shows Industrial usage of electricity. Only Industrial 2 and 3 has time of use billing so only they are included in this report. (2012) However, what we are interested in identifying the pattern not the exact % to the last decimal point. chart clearly shows industrial usage is heavily tilted towards day time use. This is when all factories, workshops those industrial and commercial zones work at full swing.
General purpose usage breakdowns were not given again due to lack of time of use concepts in those packages in 2012. However this is an easy guess when are offices, businesses, shops are mostly open ? day time. When are they use most of their office equipments, AC and fans ? day time.
So we get a picture that 60% of usage (Industrial, hotels and General Purpose) is heavily tilted towards day time use. Domestic usage (40% of total) tend to peak in 7PM-9PM and then again early morning 5AM-6AM in between those hours, usage get sharply dropped. Overall, domestic usage is tilted towards night time. When combine all, we could say that total day time energy use look more or less equal to total night time use at least on work days.
To confirm our analysis, next we will look at this problem using load data from the grid.
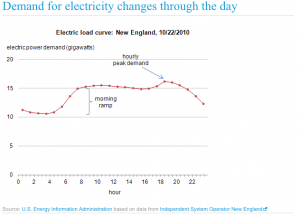
Following charts gives us the load data from different sources.
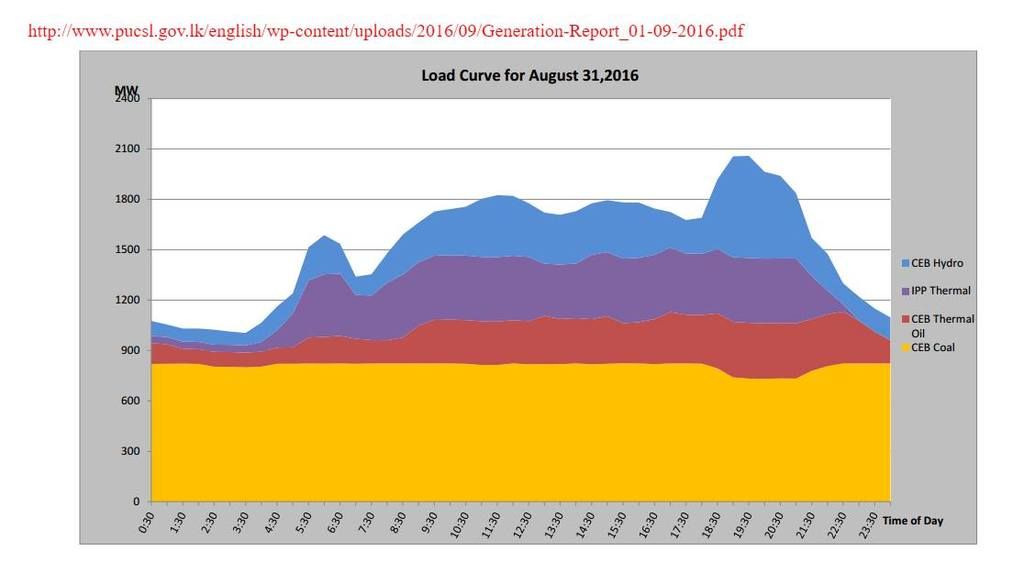
Above graph shows that peak night time is limited just around 2-3 hours. Beyond that, the demand is low at night. Day time demand however, is consistently high for about 12 hours. At least 8-9 of those hours are where we have sunlight.
Now, this is just the load. To find out exact energy used (in MWh) we need to find the area under the curves. In above diagram yellow (coal),running at constant capacity so the day time generation (and the use) is more or less same as night time. Red (diesel) and Violet (IPP thermal) are running high at equal level in day time and night time peak. At nigh time after the peak, they run at low capacity. Therefore power generation and consumption both from those sources has to be higher in day time than at night.
Blue area in the chart correspond to hydro electricity which is being used very scarcely at night time off peak hours but used at high capacities in night time peak. Hydro also runs in high capacity throughout day time. We can do a rough calculation on those blue areas and get the result that day time total usage is more or less similar to that of combined night time.
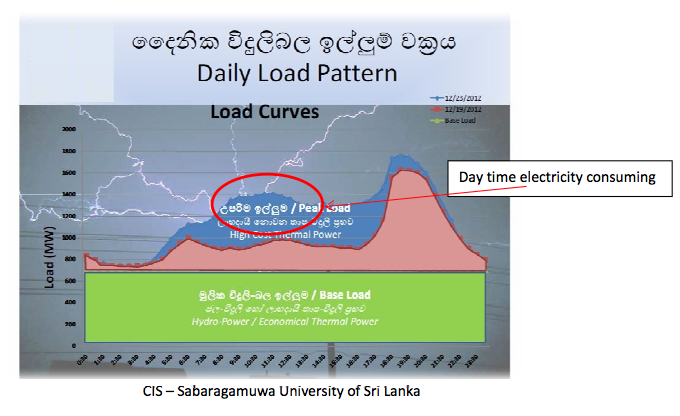
Above graph which is from a different source, again confirms same data.
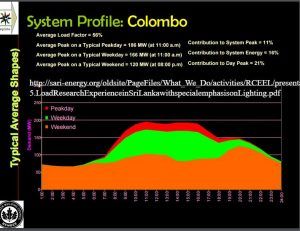
Below is the load data of Colombo, here we see the day time load is actually higher than the night time load!
In developed countries, day time use is actually more than night time use. What this shows is as a country become more industrialized and commercialised (which is the trend for any country) day time usage goes up. This is already true even for our neighbour India. Graph below is an example, observe the similarity between above graph for Sri Lanka.
What this mean is we can increase the solar generated power (which is currently only about 1% from total energy generation in the country) up to many folds and still it could be used at day time itself. Whatever excess (if we get that lucky) can be used to charge electric vehicles and power the transportation needs and we could also store some of solar energy for the night time use in batteries (by the time we implement and increase solar capacity, battery prices would have become so cheap and affordable considering the current trends in that industry)
Meeting the day time electricity demand of this country (via solar power) alone would be a huge win for us. If we can switch to electric vehicles and use solar power to charge those vehicle batteries we can power our entire transport need by free, abandon and clean solar power, that too would be a huge win by itself. In addition, we might able to store some of solar energy in batteries and use at night time, thus somewhat helping the night time electricity demand as well. If the day time demand is taken by solar power, then we could also save some of hydroelectricity generation capacity to be used at nights! Develop further wind power and wave energy can also help towards night power demand.
Suddenly solar seems much more attractive and promising! With a mixture of renewable energy sources (Sri Lanka is blessed with solar, wind, hydro and wave. Many forms of renewable energy sources), we could go a long way towards a clean and self sufficient future.
Therefore, let’s not get discouraged by what those self proclaimed pundits say. Solar energy can solve a big part in our energy problem, cleanly and cheaply. It could even help the night time usage problem and transportation problems too!

www.green-frontiers.net, 18th October 2016, By Green Frontiers
Above chart is from a typical home solar system which powers the home and charges an electric vehicle as well. System has just 6 panels (1.8KW, generating around 200 units monthly). Such a system should cost only around Rs 350 000/=.
Now, the point is the time frames. System start producing up to 30% of it’s full capacity by as early as 8AM in morning. It can keep producing 30% of the capacity even as late as 5PM in the evening. What this mean is that if we have enough solar panels (which are pretty cheap these days and getting cheaper every month) deployed around the country, we can power our energy needs from 8AM to 5PM a full 9 hours!
A shortage of sunlight in one area of the country will be offset by another area if solar systems are scattered around the country. Unlike traditional power plants they don’t have to scatter all in one place! Even if we have large scale solar farms, we could still distribute those farms across country.
There is a perception that the electricity is primarily needed in the night. It is understandable common citizen would believe as such because that’s the pattern of our home consumption. However, as a country, that’s not the situation. All those factories, industrial zones, work places, offices, businesses, shops they all consume more energy at day time than in night.
So, powering 8-9 hours of day time with solar seems to be a huge achievement if we can reach that! this brings up the question, exactly how much electricity (as a % from our total consumption) do we consume at day time ? and how much solar energy we produce currently to meet that consumption. Second part of the question is easy enough to answer. As per 2014 data, solar power is around 1% of our total electricity generation.
Exactly how much % of electricity do we consume at day time?
Lie (බොරුව) : Sri Lanka need electricity mainly at night, so producing solar at day time is of little use, we will anyway have to produce electricity at night in the current capacity using all our coal and diesel plants. We will have to build new ones too in order to meet the growing demand.
Truth (ඇත්ත) : Total night time electricity demand (in MWh) and total day time electricity demand (in MWh) are more or less same in Sri Lanka. (in work days at least). Therefore we have scope to increase solar electricity (currently at just around 1%) by several folds and actually solve a big part in our energy problem.
It was difficult to find direct stats on day time and night time use, so we used following analysis from available and verified data. If anyone one has access to any published and official figures they are most welcome to share those in here.
According to 2012 statistics, following is the distribution of electricity sales in Sri Lanka across different categories. Note that Domestic usage is only 40% and about 60% are either Industrial (factories, workshops etc), General purpose (offices, businesses, shops etc) or Hotels.
Following is the hotel sector power usage pattern. Day time usage is the highest component and is roughly 50%
Below chart shows Industrial usage of electricity. Only Industrial 2 and 3 has time of use billing so only they are included in this report. (2012) However, what we are interested in identifying the pattern not the exact % to the last decimal point. chart clearly shows industrial usage is heavily tilted towards day time use. This is when all factories, workshops those industrial and commercial zones work at full swing.
General purpose usage breakdowns were not given again due to lack of time of use concepts in those packages in 2012. However this is an easy guess when are offices, businesses, shops are mostly open ? day time. When are they use most of their office equipments, AC and fans ? day time.
So we get a picture that 60% of usage (Industrial, hotels and General Purpose) is heavily tilted towards day time use. Domestic usage (40% of total) tend to peak in 7PM-9PM and then again early morning 5AM-6AM in between those hours, usage get sharply dropped. Overall, domestic usage is tilted towards night time. When combine all, we could say that total day time energy use look more or less equal to total night time use at least on work days.
To confirm our analysis, next we will look at this problem using load data from the grid.
Following charts gives us the load data from different sources.
Above graph shows that peak night time is limited just around 2-3 hours. Beyond that, the demand is low at night. Day time demand however, is consistently high for about 12 hours. At least 8-9 of those hours are where we have sunlight.
Now, this is just the load. To find out exact energy used (in MWh) we need to find the area under the curves. In above diagram yellow (coal),running at constant capacity so the day time generation (and the use) is more or less same as night time. Red (diesel) and Violet (IPP thermal) are running high at equal level in day time and night time peak. At nigh time after the peak, they run at low capacity. Therefore power generation and consumption both from those sources has to be higher in day time than at night.
Blue area in the chart correspond to hydro electricity which is being used very scarcely at night time off peak hours but used at high capacities in night time peak. Hydro also runs in high capacity throughout day time. We can do a rough calculation on those blue areas and get the result that day time total usage is more or less similar to that of combined night time.
Above graph which is from a different source, again confirms same data.
Below is the load data of Colombo, here we see the day time load is actually higher than the night time load!
In developed countries, day time use is actually more than night time use. What this shows is as a country become more industrialized and commercialised (which is the trend for any country) day time usage goes up. This is already true even for our neighbour India. Graph below is an example, observe the similarity between above graph for Sri Lanka.
What this mean is we can increase the solar generated power (which is currently only about 1% from total energy generation in the country) up to many folds and still it could be used at day time itself. Whatever excess (if we get that lucky) can be used to charge electric vehicles and power the transportation needs and we could also store some of solar energy for the night time use in batteries (by the time we implement and increase solar capacity, battery prices would have become so cheap and affordable considering the current trends in that industry)
Meeting the day time electricity demand of this country (via solar power) alone would be a huge win for us. If we can switch to electric vehicles and use solar power to charge those vehicle batteries we can power our entire transport need by free, abandon and clean solar power, that too would be a huge win by itself. In addition, we might able to store some of solar energy in batteries and use at night time, thus somewhat helping the night time electricity demand as well. If the day time demand is taken by solar power, then we could also save some of hydroelectricity generation capacity to be used at nights! Develop further wind power and wave energy can also help towards night power demand.
Suddenly solar seems much more attractive and promising! With a mixture of renewable energy sources (Sri Lanka is blessed with solar, wind, hydro and wave. Many forms of renewable energy sources), we could go a long way towards a clean and self sufficient future.
Therefore, let’s not get discouraged by what those self proclaimed pundits say. Solar energy can solve a big part in our energy problem, cleanly and cheaply. It could even help the night time usage problem and transportation problems too!
